Reporting FAQ
This article applies to Pro, Team, and Legacy editions.
Find answers to frequently asked questions about Centercode's Reporting tool & its vast capabilities
Table of Contents:
- How do I create a Report in Centercode?
- What is a Macro Report?
- What is a Custom Report?
- How do I distribute Reports to other members of my team?
- How do I export Survey or Feedback data via Spreadsheet?
- How do I see files in my report?
- How do I bulk export files attached to Forms?
- How do I create a Filter for my Report?
- How to I configure a report-level Filter?
- Can I integrate my Reports with other software like Tableau?
- Can I Report across Projects?
- How can I embed Centercode reports in other tools (like Confluence)?
- Reporting Expectations
- How long should reports take to complete?
- Why is my report missing data?
- My Macro Report shows that it was refreshed, but it's still loading. What should I do?
- My Spreadsheet Report shows that it was refreshed, but it's still loading. What should I do?
How do I create a Report in Centercode?
If you're looking to create a report with a few clicks, Centercode offers simple methods of getting data that you have collected out of your platform. Within their respective management pages, you can create a high level overview of your data in the form of beautiful graphs and charts via PDF with Macro Reports or create Custom Reports. (Read More about Creating Reports in Centercode)
What is a Macro Report?
Macro Reports quickly output an entire form’s worth of processed results. They allow you to quickly build a report containing many related elements by instructing the Reporting system to create a full report on the form of your choice from Surveys, Tasks, and Feedback Types. (Read More about Macro Reports)
What is a Custom Report?
Custom Reports (or Element Reports) allow you to select individual criteria for each individual chart, spreadsheet, or export. These elements can span multiple forms and data sets.
How do I distribute Reports to other members of my team?
Distributing a Report sends you a complete package of your choice of formats including PDF, XLSX, and HTML via email. You can choose to send a one-off distribution to the email address(es) of your choice, or set up an automatic, scheduled distribution to entire Project Teams or a list of individuals. (Read More about Distributing Reports)
How do I export Survey or Feedback data via Spreadsheet?
You can quickly export your raw data from Surveys and Feedback into a spreadsheet format with Quick Form Export. This features allows you to work with and export your data without having in-depth knowledge of the Centercode Reporting engine. (Read More about Quick Form Export)
How do I see files in my report?
Appropriate form types (User Profiles, Test Platforms, Surveys, and Feedback Types) include a hover-over Export Files (paperclip) icon used to export any files attached to the desired form.
How do I bulk export files attached to forms?
Asking testers to submit files with surveys, profiles, and feedback is a very common (and often best) practice for our customers. Whether you’re collecting screenshots or logs associated with Bug Reports, video records of unboxing, or pictures of thermostat wiring, file attachments can be a crucial piece of your unique Customer Validation puzzle. Since access to those files is so important, we’re making sure you have the tools necessary to access them on demand.
File Attachments
For testers, uploading files to the Centercode Platform is available in two specific areas:
- File Attachment Elements on any of Centercode’s available form types (User Profiles, Test Platforms, Surveys, and Feedback Types)
- Feedback Replies, commonly referred to as feedback comments or discussions
These upload points are commonly used to gather context for tester selection, feedback triage, or survey analysis.
Using the form attachment export tool
Accessing the Export Files feature is an extremely simple matter. Appropriate form types (User Profiles, Test Platforms, Surveys, and Feedback Types) include a hover-over Export Files (paperclip) icon used to export any files attached to the desired form.

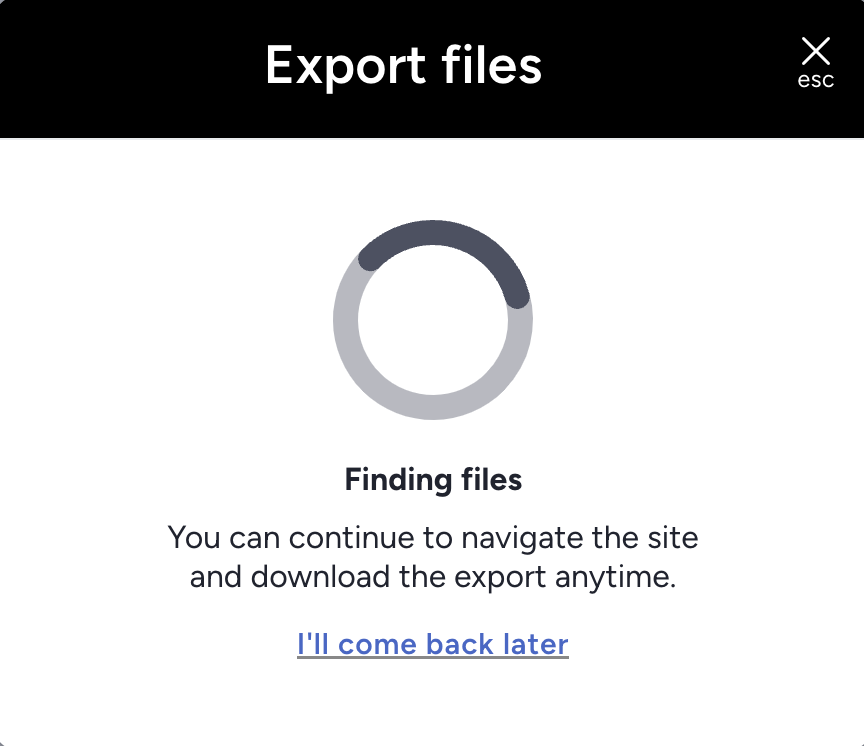
Once selected, the Centercode platform displays a lightbox progress dialogue. At this stage, you can “come back later” to retrieve the ZIP results or wait without interrupting your export action.

From here, two outcomes are possible:
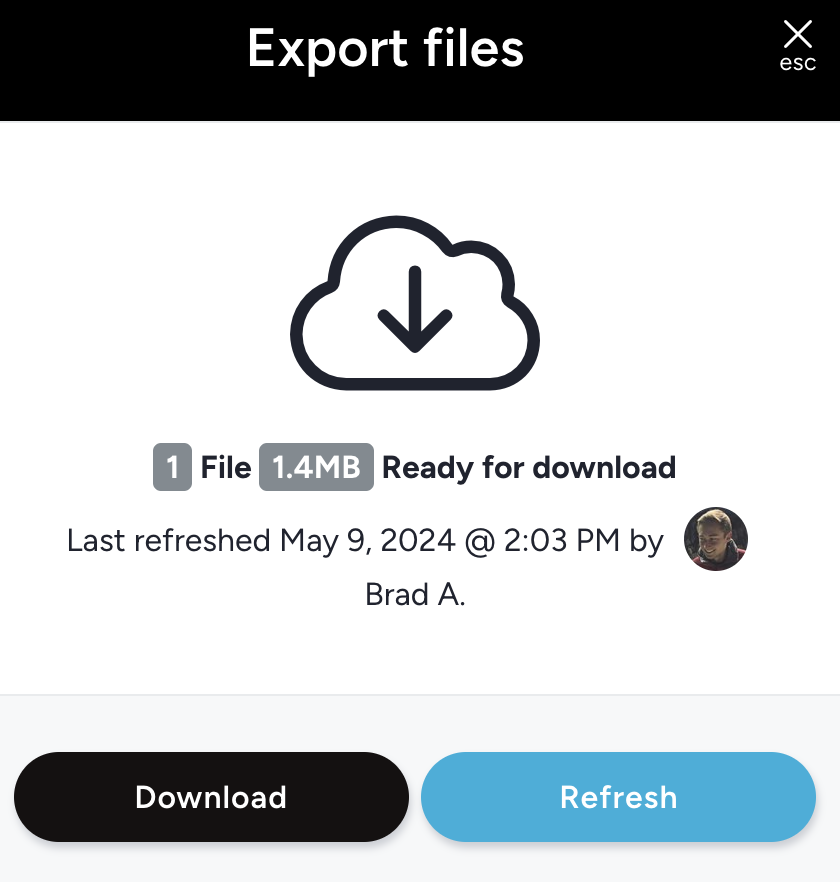
(a) the system identifies that files are present and zips your form’s attached files

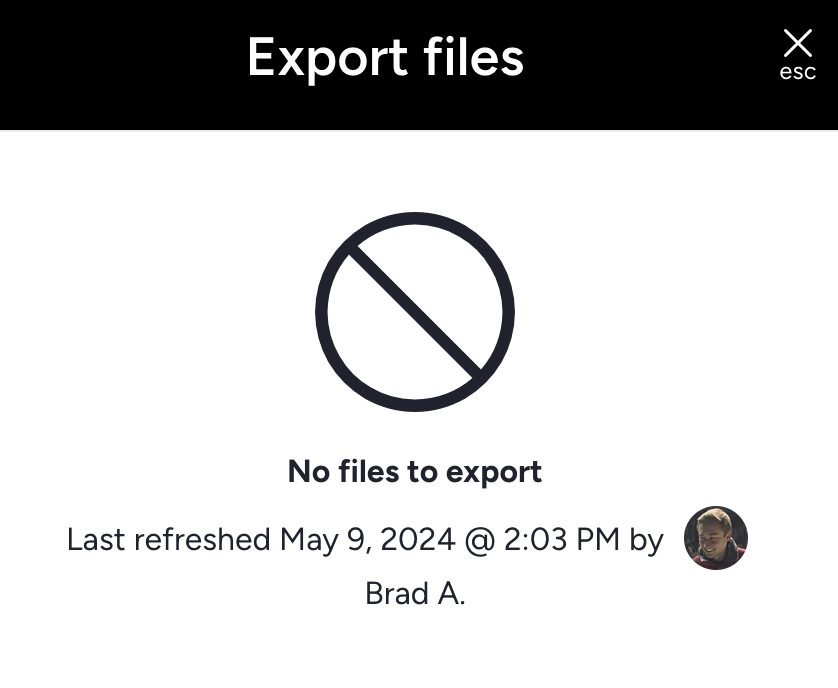
(b) the system receives a response that there are no files attached to the form
File export results
When files are located, compressed, and ready, the resultant zip is organized based on the form type:
- User-based forms (e.g. Surveys, Profiles, Platforms) are organized by Project Name - Form Name / Username
- Feedback-based forms (e.g. Bug Reports, Suggestions, etc.) are organized by Project Name - Feedback Form Name / Ticket ID
A File Export for a user-based survey showing Usernames

How do I create a Filter for my Report?
Centercode allows you to access any data gathered by the system, such as your dynamic forms (Surveys, Feedback, Content, etc), and then view that information either directly in your portal or export it out via Reports. Creating a Filter helps to to narrow your Report results to specific criteria, such as "Active Users". (Read More about Building Filters and Views)
Reports have two methods of filtering. Filters can be configured individually for each elements within the report, or report-level filters can be configured that will apply to all elements of a given data source (ie. user data, specific feedback types, etc.)
How to I configure a report-level Filter?
- Navigate to the Modify this report section of a given report
- Scroll down to the Filter section of the report (will contain a filter section for each data source used within all report elements)
- Select the New icon to create a report-level filter for that data source
- Select your filter parameters and click Create filter
NOTE: Once a report level filter has been applied to a report all elements using that data source will use that report-level filter. You will not be able to mix-and-match which elements use the filter.
Can I integrate my Reports with other software like Tableau?
Through Enhanced Integrations, Centercode's Data Packages offer the ability to create and share custom data sets for consumption by third-party systems. This is perfect for injecting bulk data into systems like Tableau, Domo, or Google Sheets to take advantage of their extensive analysis and visualization capabilities. (Read More about Integrating Centercode Reports with other Software)
Note: The above capabilities require Centercode's Enhanced Integrations package
Can I Report across Projects?
With an Enterprise License of Centercode, Reporting across various Projects becomes possible thanks to Cross Project Labels. Cross Project Labels are unifying labels created by Community Admins and used to identify similar resources across projects that may not use the same vocabulary. For example, Feedback types in separate projects that might be titled differently (such as Issues, Problem Reports, Bugs) can all be unified under the "Bug Reports" Cross Project Label to open up the ability to Report on them across Projects. (Read More about Using Cross Project Labels)
How can I embed Centercode reports in other tools (like Confluence)?
After you've defined your report (selected data, added filters, set styles) and clicked Submit, the following page includes an Additional Option called Enable Script Embedding (shown here). This refers to the ability for each report element to generate an embed code to be placed in other systems to gain access to your report, if that system can convert HTML. The report element will be as current as the report is within your Centercode implementation. If your report is set to Refresh on an interval, your data will as current as that interval.
To embed Centercode report elements in other systems:
- Configure a custom or Macro report (How to create reports article here)
- Click Submit
- On the Create Report page, scroll down and click Enable Script Embedding
- Click Submit to will load and then complete your Report
- Click the Interactive Mode pencil on your Report
- Click the Modify pencil on the Report Element you wish to add to embed in another tool
- Click the </> icon
- Copy the Report Element Embed Code
- Add that to your system that is able to convert HTML
Reporting Expectations
If you're looking for why your report hasn't yet completed, you'll need to consider what occurs when running a report in Centercode. The process is broken down into two parts:
- Data collection - report may have to scour huge swaths of data to pull back all the information you're requesting. This is particularly true for Community level reports, or reports in Projects with lots of users or lots of history. This step takes seconds up to several minutes.
- Visualization - Once the data is collected and organized, the system arranges the data to be visualized, then generates your charts, graphs, word clouds, etc. The system then creates PDF and Excel versions of your report. This step doesn't typically take very long, but if there are many report elements and users in your report, the system must loop through this action multiple times.
How long should reports take to complete?
Most reports only take a few seconds to several minutes for data collection, then up to several minutes for visualization, depending on the amount of data and your infrastructures current status. This means that you may have to wait a couple minutes for your report to START running.
That said, we're always working on scaling up our infrastructure, but if you're waiting for your report for too long, don't hesitate to reach out - we'll investigate for you.
Why is my report missing data?
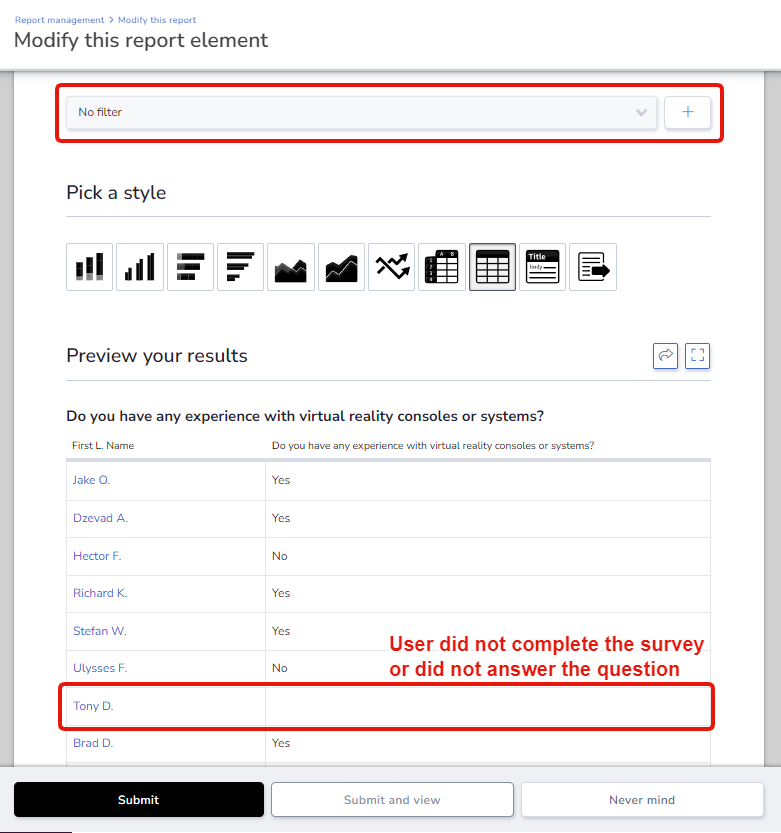
Your data isn't missing, but rather, you're criteria may not have data available yet. This is generally caused by your Filter and/or your View not aligning to have criteria to match your needs.
Adding a Filter to your report (or Advanced View) hones the scope of data you want to see. You’re setting criteria you want your data to match. If you'd like to see all results, No Filter may work for you.
Your report's (or Advanced View) View items is the data you’d like to see (similar to spreadsheet columns) regarding your filtered results. If your View items aren't relevant to your Filter, you'll generally see blank results.
For example, if you're building a report with View items for Survey responses but aren't using a proper filter Filter, then your results will include users regardless of their Survey completions. In this case, you should filter for users who completed the Survey.

More on Filters and Views here.
My Macro Report shows that it was refreshed, but it's still loading. What should I do?

In some cases, if your Macro Report is over 30 days old and Report Management shows that it refreshed recently, but still shows that it's Loading Report, you may need to re-create your report.
My Spreadsheet Report shows that it was refreshed, but it's still loading. What should I do?
Spreadsheet style reports are a reporting style selection to view results within your browser in your Centercode implementation. Also in some cases, spreadsheet style reports may be stuck on Loading, but Report Management shows that it had finished refreshing due to too many results to show on the screen.
A resolution to this would be to change the report's style from Spreadsheet to File Export. This makes the system generate only the report files rather than the visualization of data in-site. If your goal is to export data, this will work well for you.
To change your Report's style to File Export from Report Management:
- Hover over your Report and click the Modify pencil
- Click the Report Element under Single report elements
- Scroll down to Pick a style and select File export
- Click Submit and view to save your changes


