Centercode Basics: Data, Filters, & Views
The Centercode Data Engine gives you access to all your captured data including Filters, Views, Dynamic Tags, custom reports, and more!
This article applies to All editions.
Table of contents
What is "data" in Centercode?
All data in Centercode belongs to one of three core data objects:
-
User - Demographic, behavioral, and technographic data about your users.
-
Feedback - Submitted tester input like Issues, Ideas, Praise, or Discussions.
-
Project - Configuration and metrics related to your test environment.
Each of these core data objects can have extensions of data, which can take many different forms.
When a user fills out a user profile indicating their demographics or their interests, each one of those fields used to collect data becomes an extension of that user's record in the system. The data can come from:
-
Explicit data submitted by users (e.g., responses to surveys or profiles)
-
Implicit data automatically collected by the Centercode platform (e.g., logins, activity history, device access, completion status)
Where the Centercode Data Engine really shines is combining and reusing that data throughout the platform. Each new piece of data collected extends, enhances, and enriches the data you've already collected! This data can be combined and reused in many many ways all throughout the platform.
The primary way you will access this data and define how you want it to be used or displayed is through the use of filters and views. Filters and views allow you to control what data you see in your reports, or which users and data your macros and automation are targeting.
Filters and Views
Filters and views define how you target and display data within the platform.
-
A Filter determines which records are included (rows)
-
A View defines what information you see about each record (columns)
Think of it like a spreadsheet:
-
The Filter sets the rows (e.g., only users who completed a survey)
-
The View sets the columns (e.g., user name, score, email)
You can apply filters and views in:
-
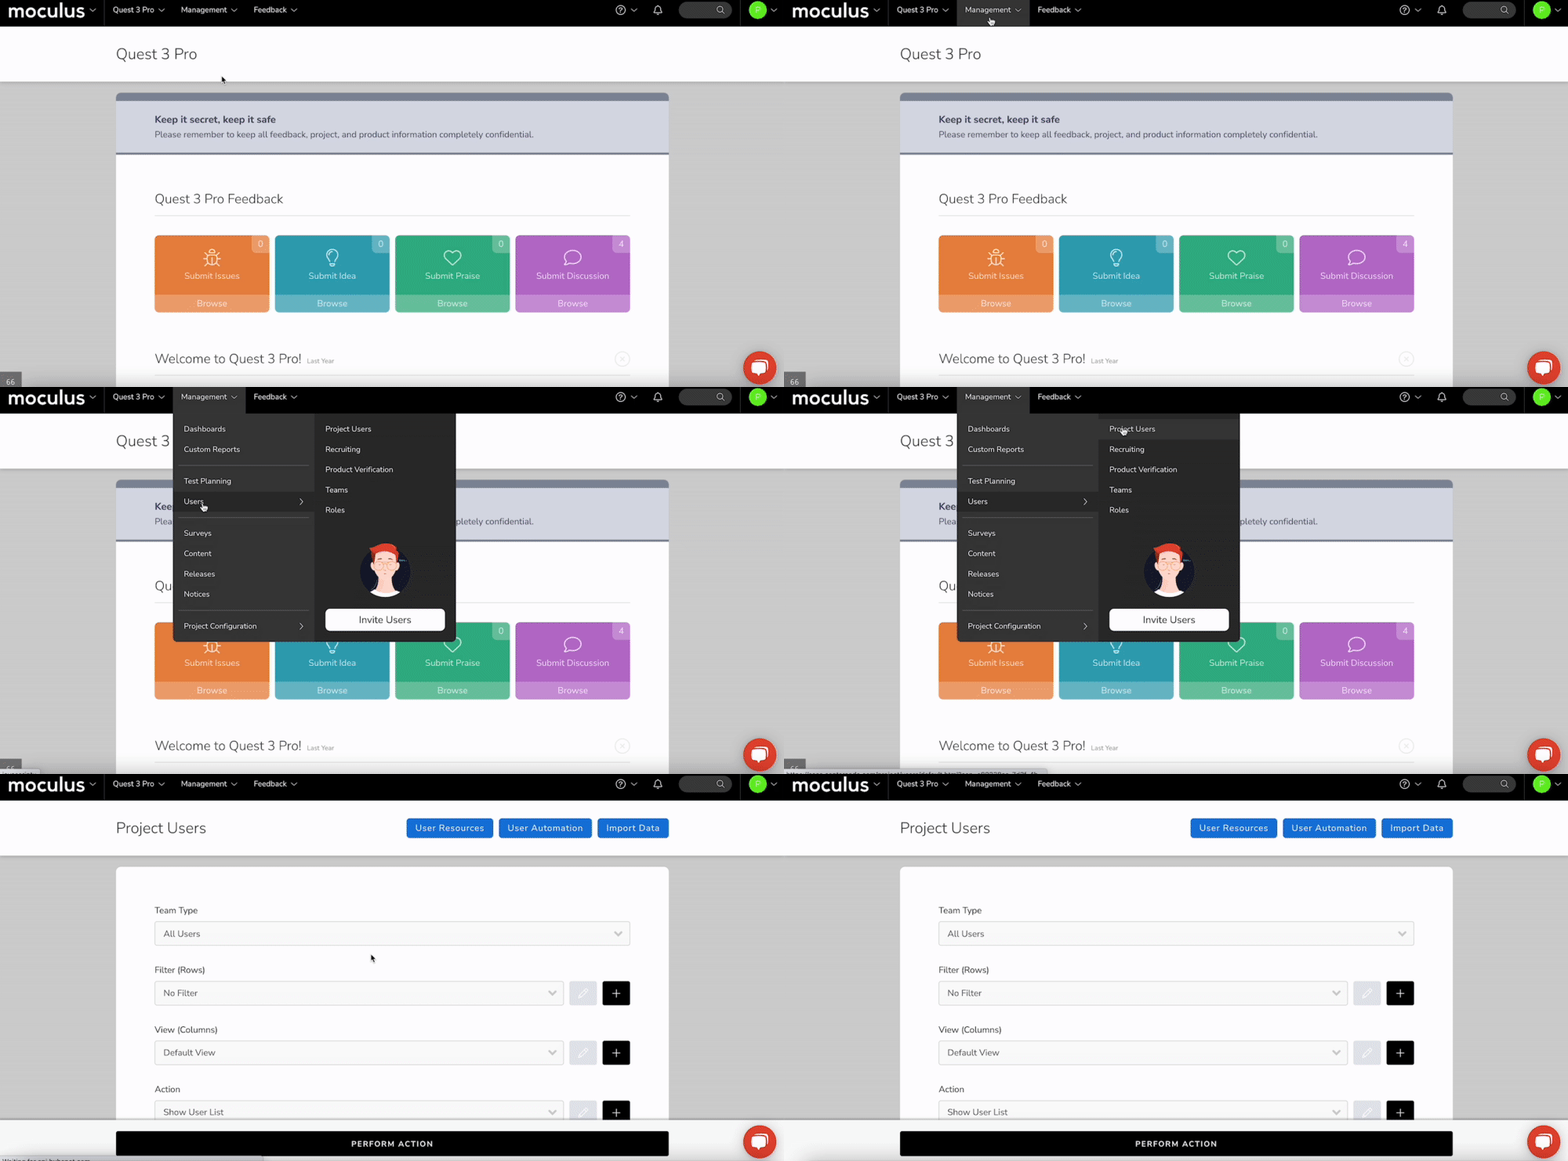
Community/Project users
-
Feedback management
-
Custom reports
-
Automations
-
Macros
Creating Filters and Views
Creating a Filter
Data collected from your users live in your portal and can be pulled via Reporting, Feedback Management, or the Community/Project users tool depending on the type. Building a filter hones the scope of data you want to see. You’re setting criteria you want your data to match. If you'd like to see all results, No Filter may work for you.- Navigate to an area of the platform that utilizes the Centercode Data Engine (such as user lists, feedback management, or reporting)
- Click the + button to the right of the filter drop-down
- Click the + button to add a new filter
- Select the desired Data Set, Item, Default Qualifier, and optionally a Default Value
- Click Add To Filter
- Repeat steps 3 and 4 until all desired filter criteria have been added
- Click the Create Filter at the bottom
Creating a View
Once your filter is complete, it’s time to build a view. Think of your view as the actual information you’d like to see regarding your filtered results. For example, if you filter for users who signed an NDA, then you’ll want to view the following information: Full Name, Project Teams, NDA Complete, NDA Date Complete.
- Click the + button to the right of the View drop down
- Select the Data Set and highlight the item in the left text field
- Double-Click the item to move it to your view.
- Repeat steps 3 and 4 until all desired view items have been added to the view
- Click Create View and Execute to see your results
Use Case Example: NDA Compliance
Let’s say you want to see all users who have signed the NDA and when:
-
Filter: Users where "NDA Complete" is equal to "Yes"
-
View: Full Name, Email, NDA Date Complete
You can then export this data or use it to power an automation.
