Creating a report element in Centercode involves selecting the specific data you want to display and configuring how it’s presented. You'll be able to configure, via filters and views, what records you want to see and the specific info about each record you want displayed.
Filters and views define how you target and display data within the platform.
-
A filter determines which records are included (rows)
-
A view defines what information you see about each record (columns)
Think of it like a spreadsheet:
-
The filter sets the rows (e.g., only users who completed a survey)
-
The view sets the columns (e.g., user name, score, email)
The following video contains all the info you need to know about constructing filters and views in Centercode!
Navigating Create a Report Element
Choose a data source
The core idea behind the Centercode Data Engine is that all data in Centercode belongs to one of three core data objects:
- Feedback elements - Submitted tester input like issues, ideas, praise, or discussions.
-
User elements - Demographic, behavioral, and technographic data about your users.
-
Project (other) elements - Configuration and metrics related to your test environment.
Each of these core data objects can have extensions of data, which can take many different forms. Once you have chosen a data source, you'll be able to choose which specific data you'd like to see, and how you want that data displayed.
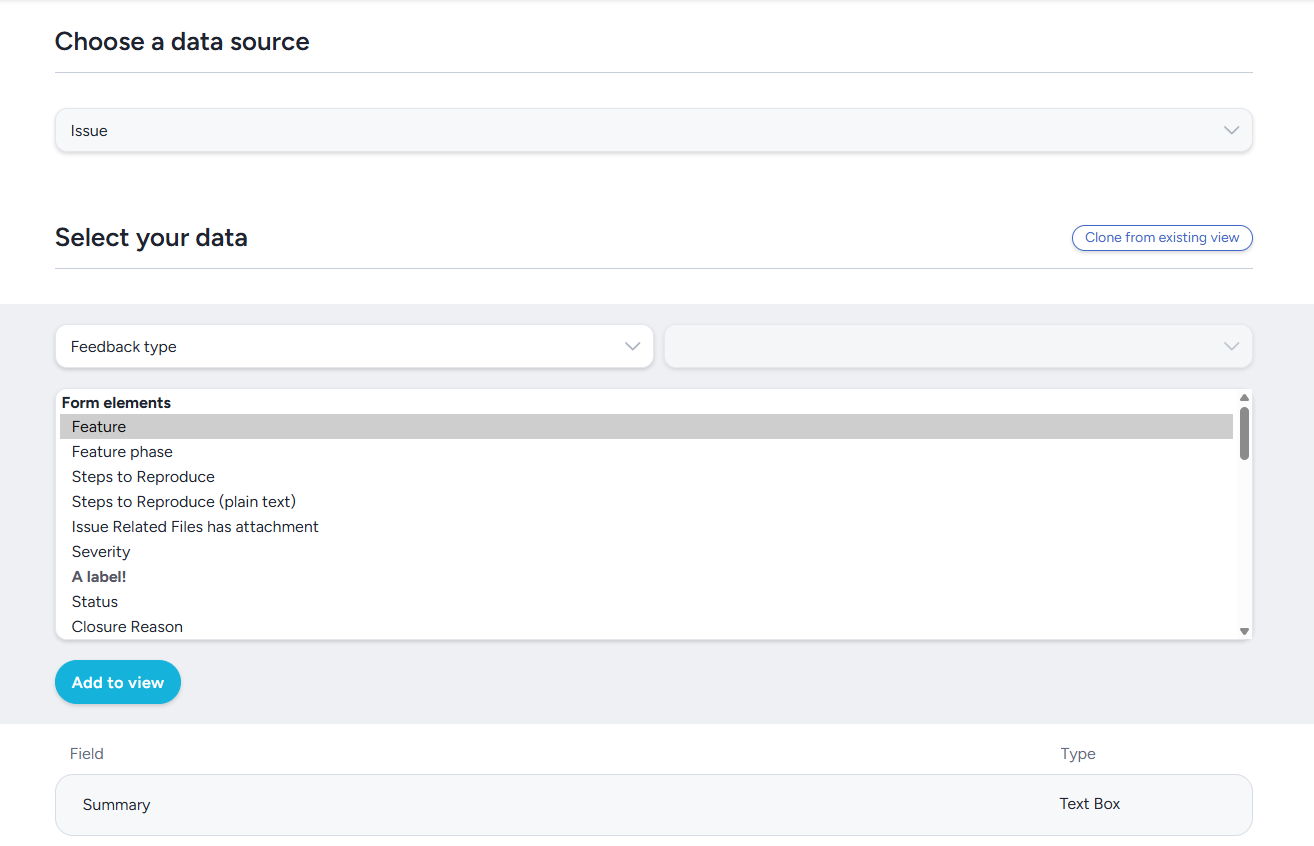
Select your data
The select your data section allows you to choose which elements from your chosen data source you'd like included in your view, and how you want that data filtered.
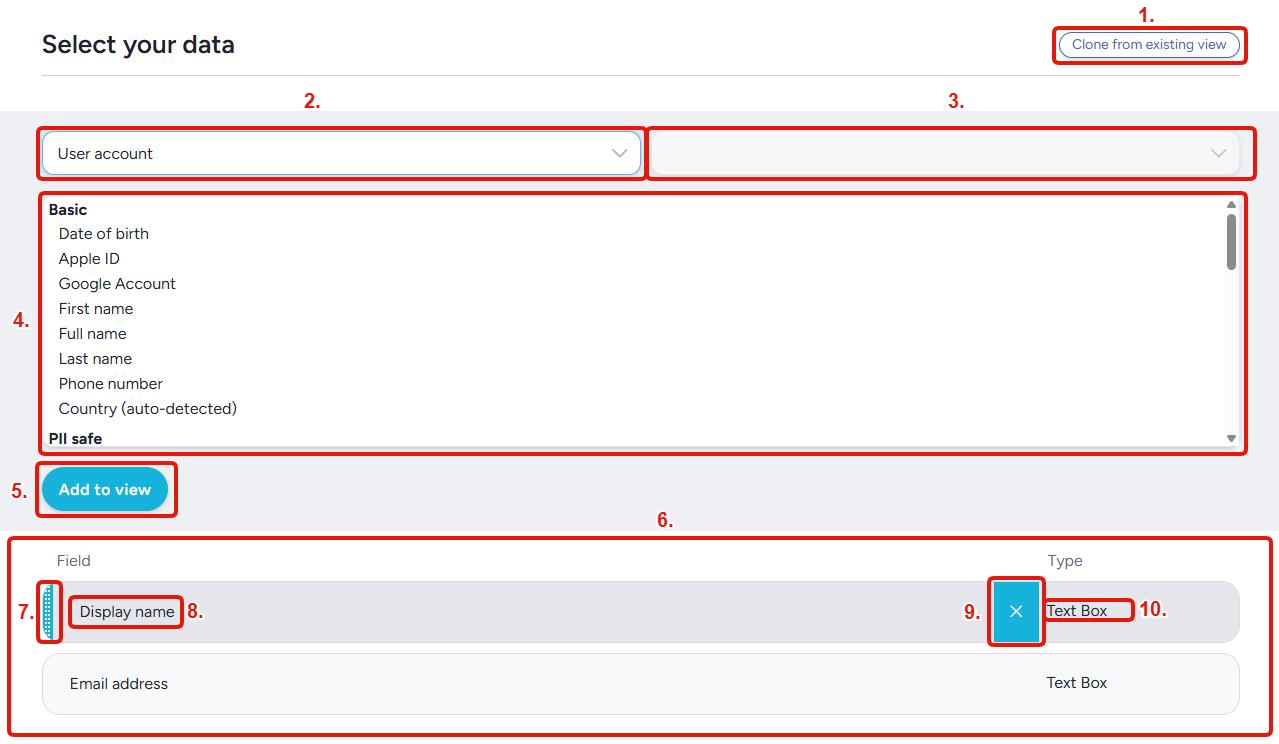
Clone from existing view: Select from any pre-existing saved views that you have access to.Primary data source: Select the data source you are pulling data points from.Secondary data source: When applicable, this box is where you will further specify the data source you would like to use. For example, if you choose surveys as your primary data source, this is where you will select the specific survey you would like to see data from.Available data points: All available data points from the data source you have will be displayed in this box. Items can be double clicked to add them directly to your view. Items that are added to the view will be removed from this box.Add to view: This button will add all selected data points to your view (if multiple items are selected).Included data points: All data points currently included in your report element will be displayed here.Position adjustment bar: Hovering over a data point and clicking and dragging this bar will allow you to adjust its position in your view.View item name: Displays the name of the data point included in the view.Remove data point: Hovering over a view item and clicking this button will remove the view item (and it will again become available in the available view items).Data point type: This will display the type of data this data point contains. (Examples include text boxes, boolean data, date data, etc)
Add a filter
If needed, this is where you will add a filter to limit/target the specific data you would like to see. In this example screenshot, the data is being filter to only show results from users on a the Participant team who have logged in within the past two days:
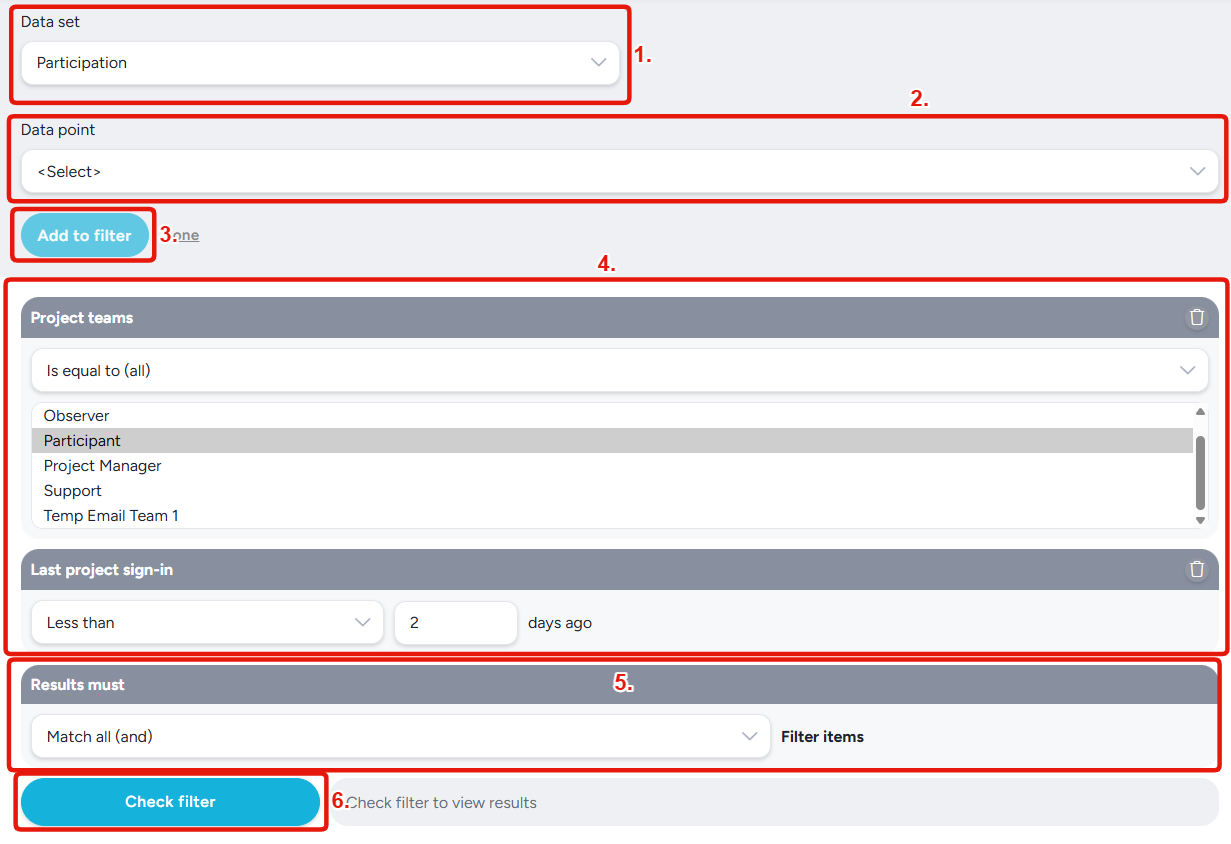
Data set: Select the top level data source/set you are pulling data points from.Data point: Select which specific data point you want to filter your data off of.Add to filter: Adds the filter item you have customized to your filter.Filter items: All items added to your filter will be displayed (and can be customized) here.Results must match: This allows you to determine whether your filter requires data to match every filter item, or any one of multiple view items.Match all (and): Data must match every item in your filter to be included.Match any (or): Data will be included if it meets one or more filter item requirements.
Check filter: This button will allow you to see how many (out of the total) records match your filter.
Pick a style
This is where you will pick how your data will be displayed. This section offers different selections depending on the number and type of items you have added to your view. This includes a number of different graphical display options (columns, bars, multi-line series, etc), as well as various data table and spreadsheet options.
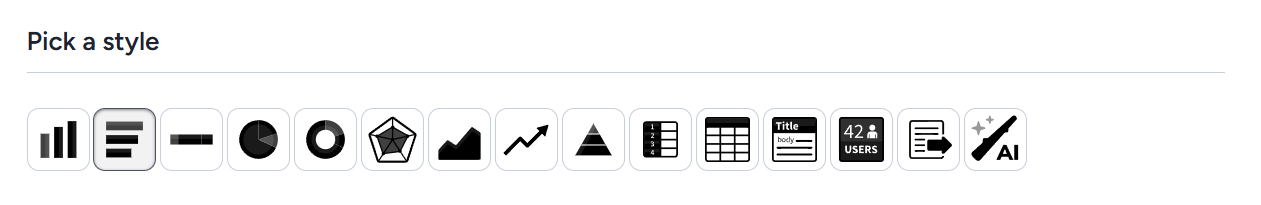
Additionally, there are a few special use case style types:
File export: This will package the results into CSV and .xlsx data available for download.Data package: A reporting style that makes this report element data available via API call (read more here).Record lookups: A reporting style that makes the data contained in this report element available for query by outside systems (read more here).AI response: Uses Ted AI to generate a report element based on your custom instructions (read more here).
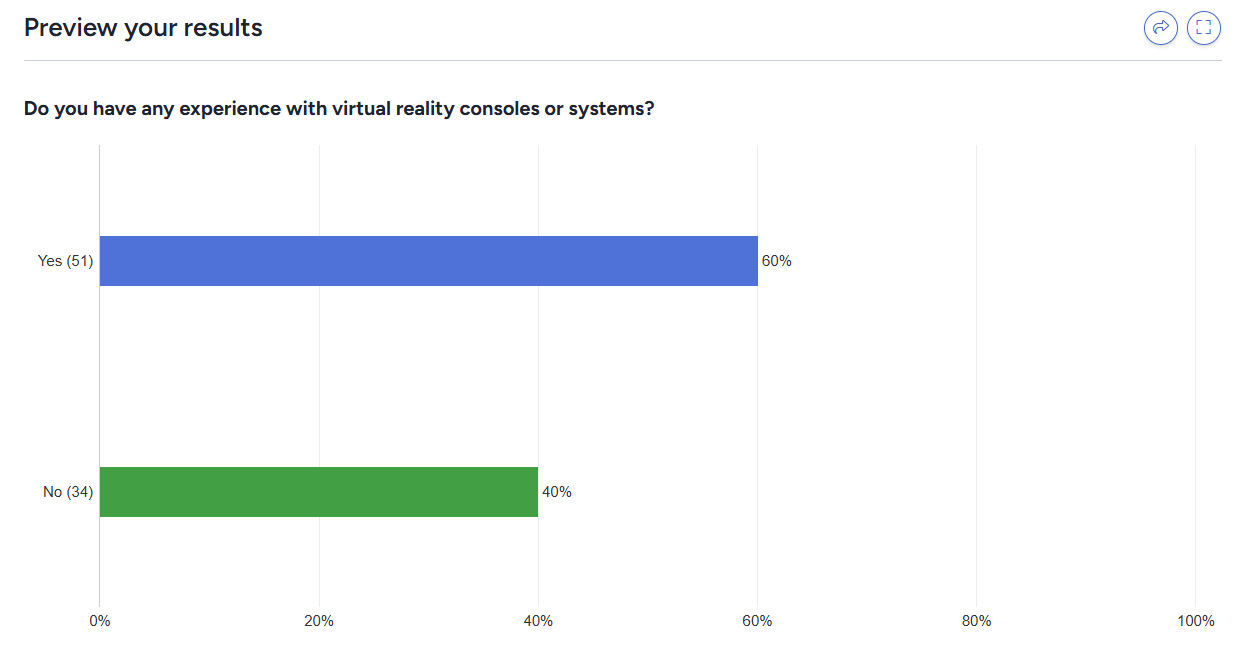
Preview your results
This section will display example results of your selected view, filter, and style selections.
Customize your results
This section has a few additional customization options for your report data.
Show data count: Enabling this option will display data count numbers next to visual display styles, as seen above.Show percentages: Enabling this option will display data percentages on visual display options, as seen above.Include data points with zero results: Enabling this option will include data points with zero results, such as survey answers with no responses, in your report.Order by rank: Enabling this will sort your report data from most to least results.Reverse result order: Reverses the display order of your report data.Adjust element size: Allows you to customize the display size of this specific report element.Don't include this element in results: This option is available for certain element types (such as labels). When this option is used the element will not be included when viewing completed tickets.
Save this to a report
This is where you will determine if you want this report element saved for later user, and if so, will prompt you for an element name, subtitle, and which report you would like it added to (or if you would like to create a new report with this as the first element).