Project Overview Dashboard
This dashboard summarizes every aspect of your project in one easy-to-access and easily shared place. Everything from the health of your project, to your top feedback and Ted’s performance (if he’s enabled). Your project introduction is also displayed here and is controlled via your project template settings.
Delta Health and Success
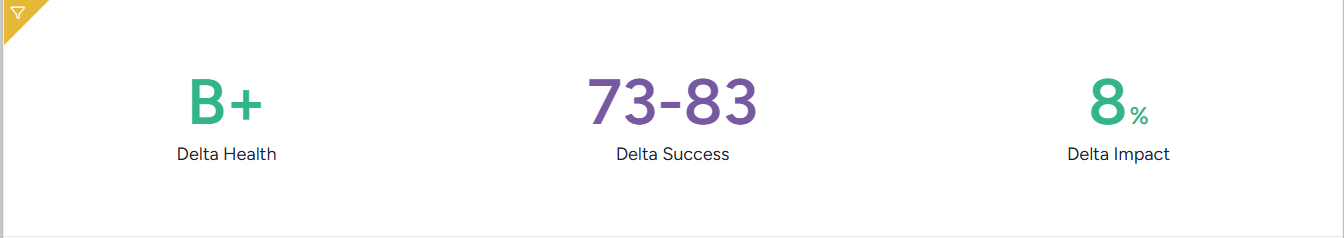
This dashboard element displays the overall Delta health and success scores for your project, which are defined as:
Delta Health: Health is a measurement of engagement from your testers. A low letter grade means that either your testers didn't complete their assigned activities, submit actionable feedback, or both. This score is critical to ensuring predictability for the success of your product.Delta Success: Success is a prediction of how successful this product will be in the eyes of your tester audience, based on the sentiment of the impact and type of feedback they provide. Success begins as a range and is represented as a whole number once health reaches an A+, ensuring a confident prediction.Delta Impact: Impact measures the effectiveness of your test by comparing the difference between your success prediction without feedback addressed (i.e. if your product had gone to market without this test) versus your success score based on the feedback you successfully addressed (i.e. your product now).
Activity Engagement and Feedback Impact
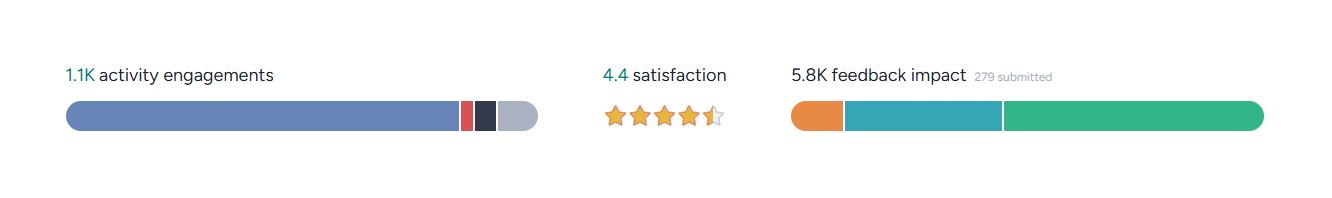
Displays the number of activity engagements (including activity completions, blocks, opt-outs, and views), average activity satisfaction score, and total feedback impact generated by each feedback type.
Project Phase Schedule
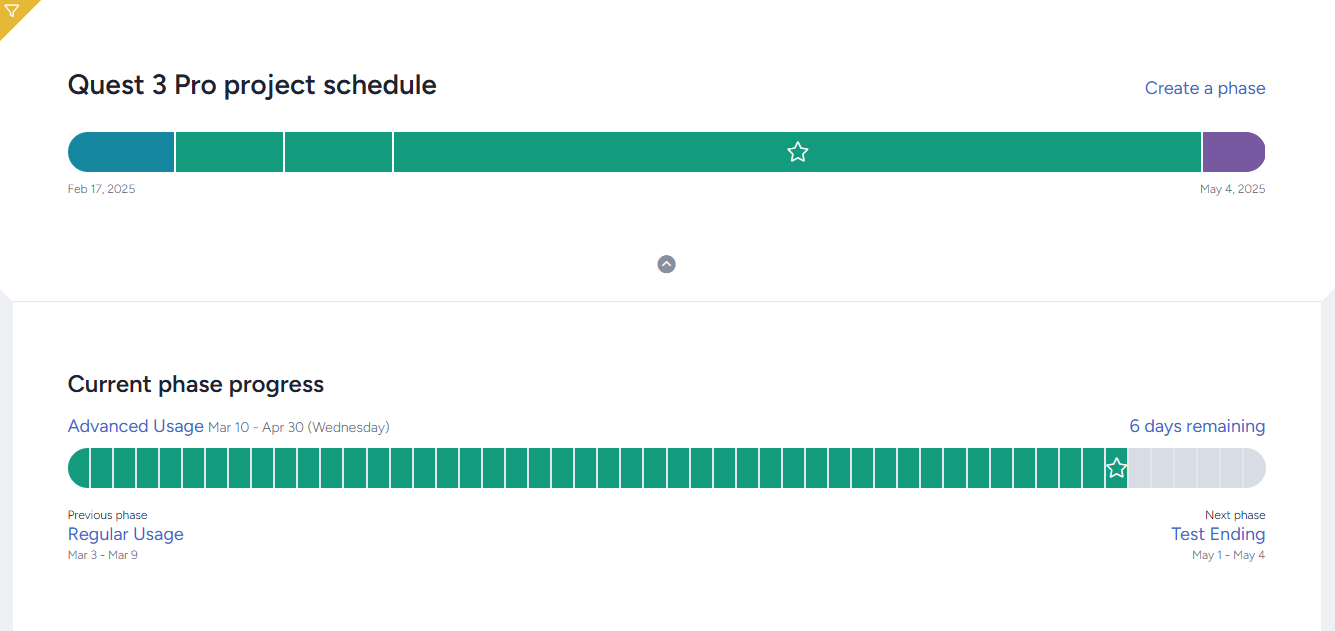
Displays the overall project phase progress, as well as information on the progress of the current phase.
Feedback Type Overview
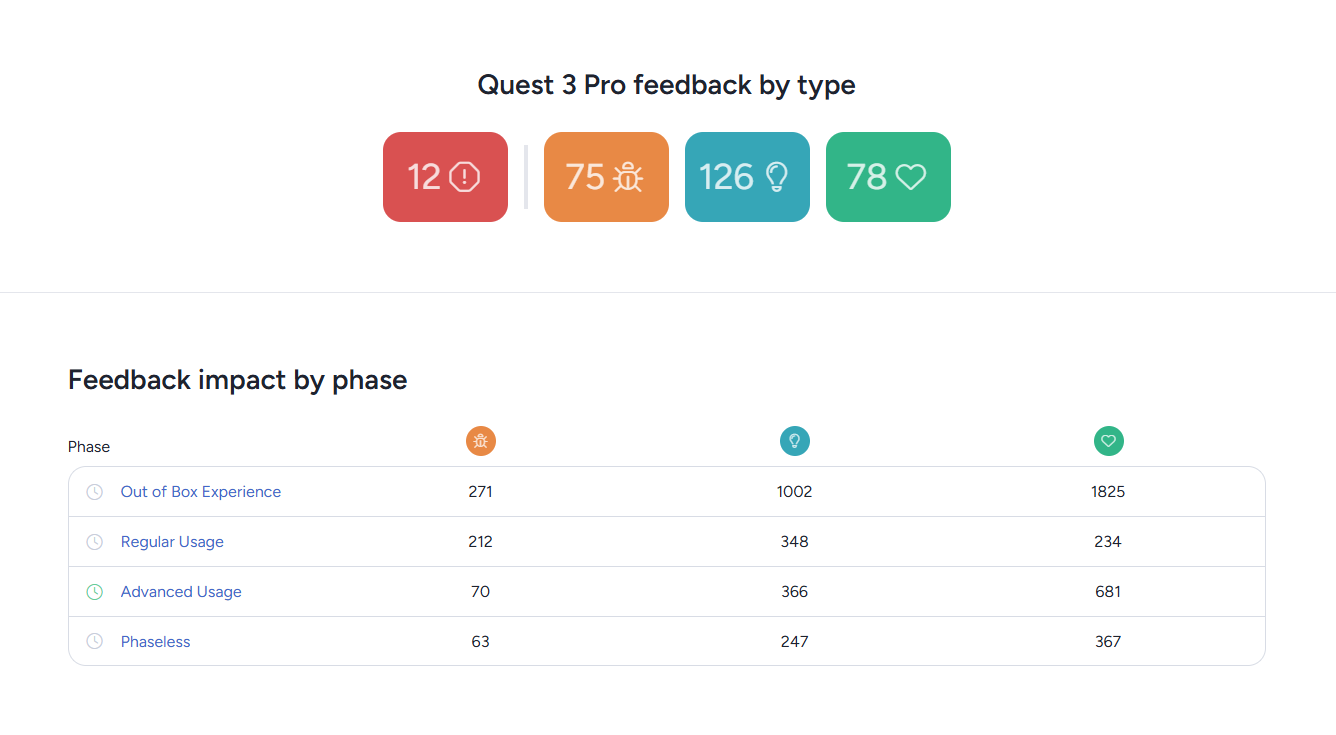
Displays information related to your various feedback types, including overall number of feedback submitted of each type, number "blocking" issues submitted, and the amount of feedback impact generated for each feedback type in each phase.
Project Audience Metrics
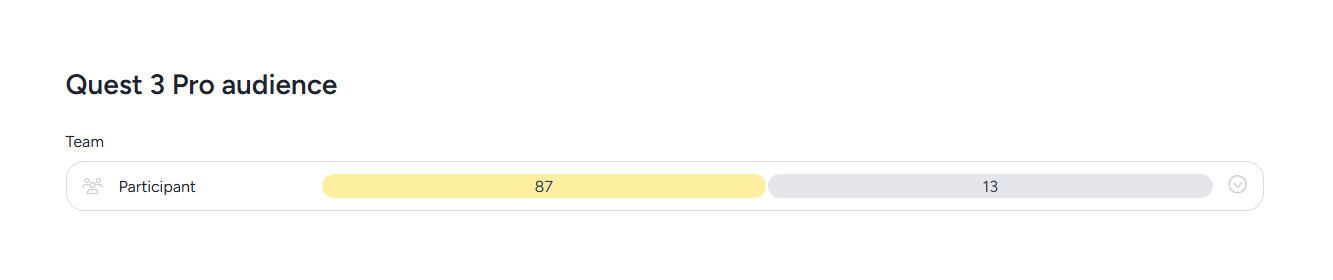
Displays the number of testers on each participant team (that has a target user number set) compared to the target number. Can be expanded to show team size over time compared to the goal during that time period.
Engagement by Phase
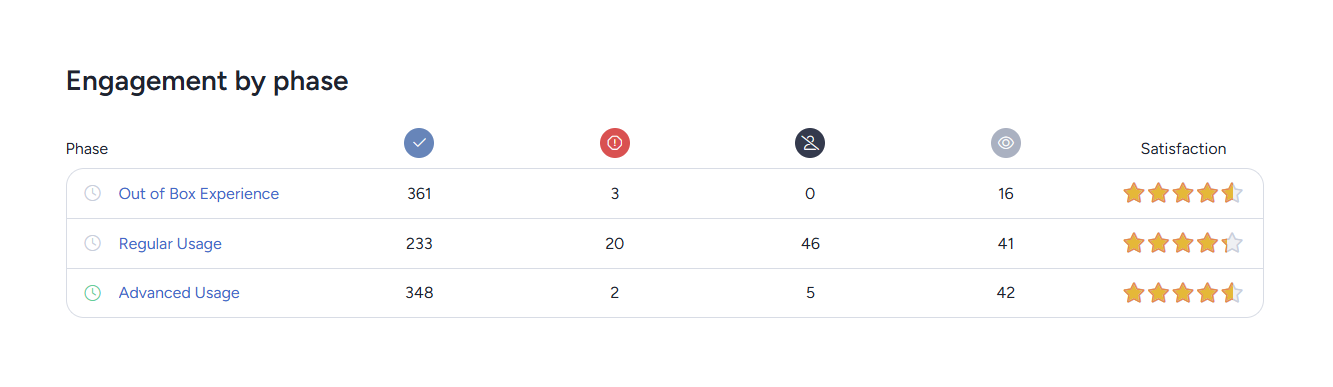
Shows a breakdown of overall feature status (completions, blocks, opt-outs, views) and satisfaction broken down by phase.
Ted’s Project Performance
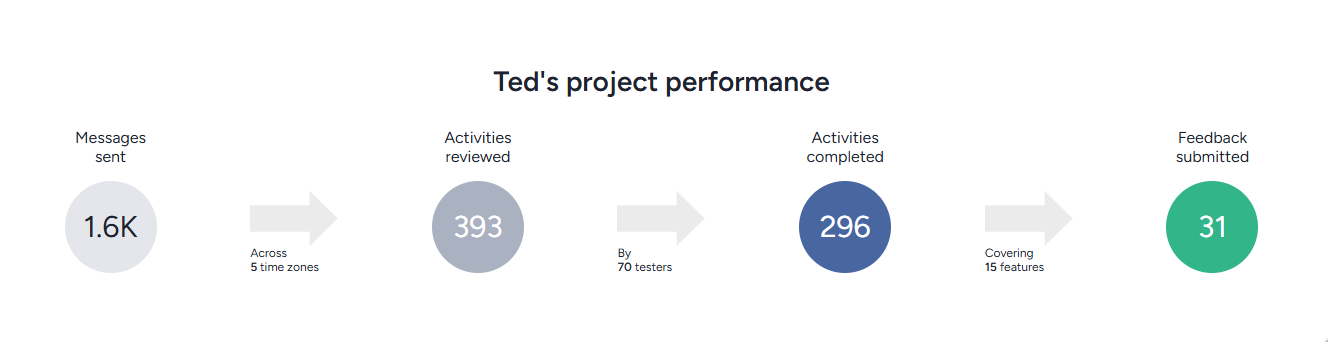
Displays Ted's email activity metrics for your project. Tracks the number of messages sent, including metrics for how many activities and feedback were viewed and completed by following links in Ted's emails.