Product Success Analysis Dashboard
This dashboard provides a unique way of looking at your project’s most impactful issues and ideas. The dashboard will analyze your feedback and provide information on how addressing the top X% (defined by you, defaulting to 20%) would effect the overall Delta Success score of your project. An easy to visualize chart shows you the exact number of tickets you'd need to resolve to have a big impact on your project success!
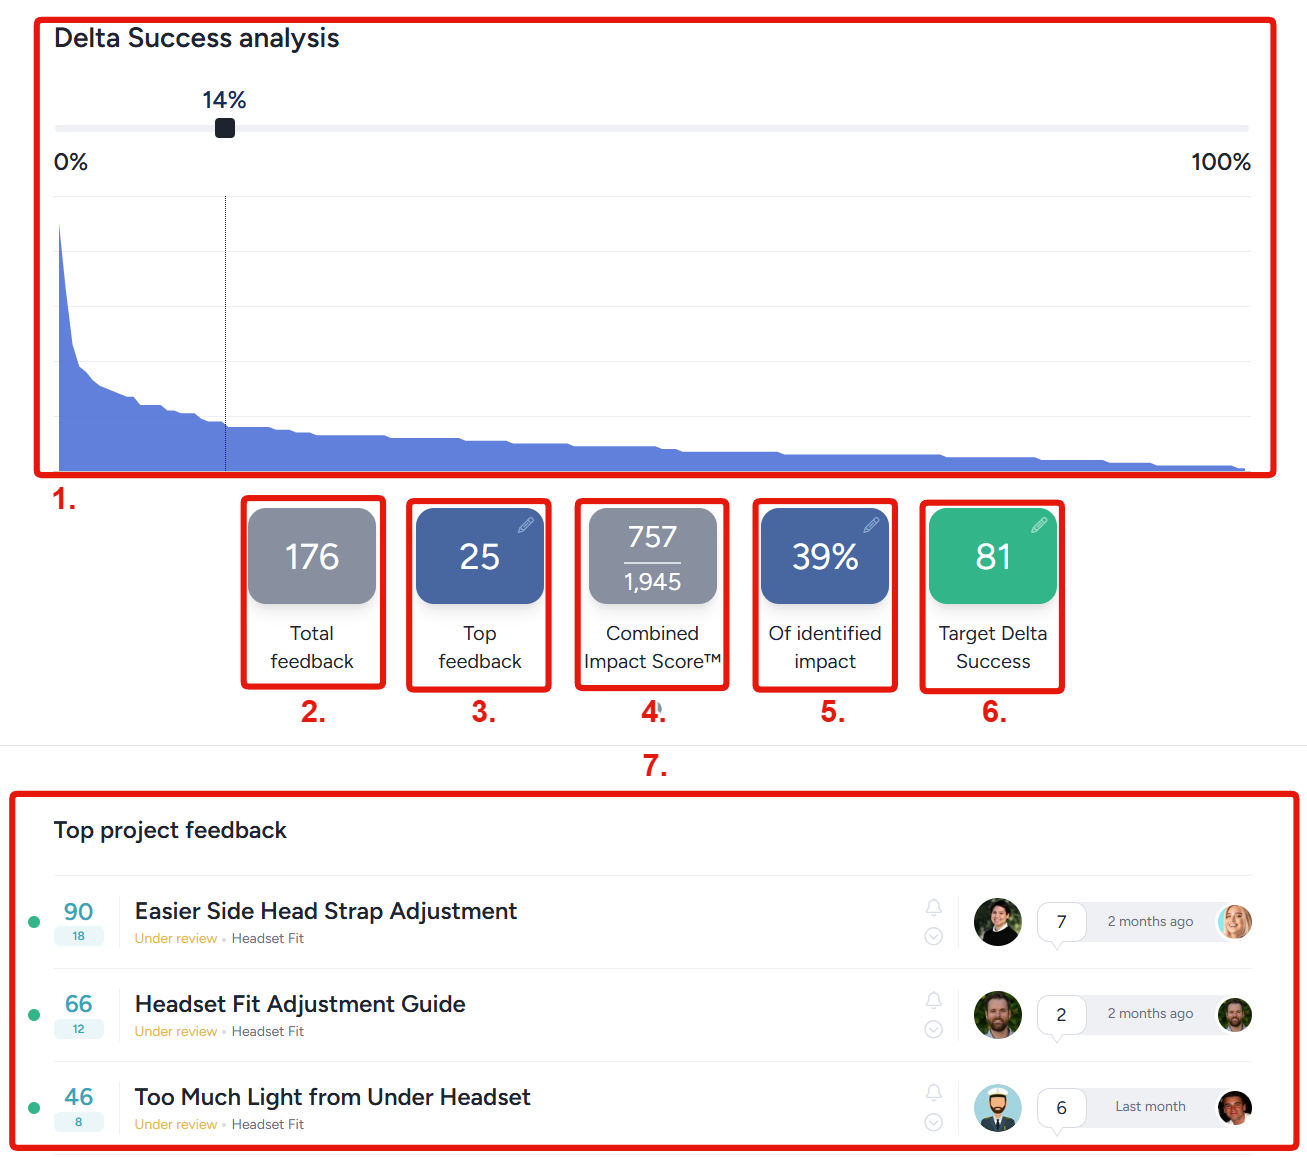
Delta Success analysis slider: Adjust this interactive slider to choose a percentage of your total issues and ideas to be addressed. The blue graph shows the amount of feedback impact captured by your selected percentage.Total feedback: Displays the total number of unaddressed issues and ideas in your project, unaffected by the position of the slider.Top feedback: Shows the number of issues and ideas associated with the position of the slider. In the example screenshot, the slider being set at 14% shows us that you'd need to address the top 25 of your 176 unaddressed tickets to get the displayed results.Combined Impact Score: Displays the sum of the impact score from the selected issues and ideas compared to the total unaddressed impact in your project. In this example, the top 14%/25 feedback submissions account for 757 impact out of 1,945 total.Percent of identified impact: Represents the percentage of total unaddressed impact that would be resolved by addressing the currently selected tickets. Simply put, this converts the Combined Impact Score into a percentage. Using the above example, 757/1,945=39%. In other words, by addressing 14% of your feedback you'll address 39% of the impact.Target Delta Success: Displays the resulting Delta Success score your project would have if the filtered tickets were addressed.Top project feedback: Displays the filtered feedback listed in order of most impact to least impact. These are the tickets you will need to address to get the results displayed in the chart!
Note: Click the pencil icon next to any of the numbers to manually define the value. The chart and other values will automatically update to match.