What Are Centercode’s Dashboards?
Dashboards organize the data generated by your project into easy-to-understand reports, graphs, and lists. Everything from the most impactful feedback, to engagement in the current phase, to top testers, and more can be displayed in a dashboard.
Dashboards consist of individual panels displaying impactful information about your test. These panels contain your core KPIs - project health, product success, and project impact, as well as many other valuable sets of data. Panels often have their own sub-panels which can be expanded to show more detailed contextual graphs and lists.
Why Should I Use Delta Dashboards?
Dashboards are designed to focus on important KPIs and metrics that help you monitor your project. They automatically update as your project progresses which allows you to have a deeper understanding of your project and the state of your product in real time. Furthermore, since dashboards are system-built based on unique signals, they can display data in ways that custom reports can’t.
While certain dashboards can display valuable data for beta projects, Centercode’s Delta dashboards become extremely useful when your project follows a Delta approach. Based on the aforementioned signals, the built-in dashboards present every valuable aspect of your Delta test without you needing to lift a finger. You can even present them from within your project or print them to PDF for easy distribution.
Navigating Centercode Dashboards
All Centercode dashboards share a similar menu and filter bar, located at the top of the dashboard. The options between each dashboard can vary slightly depending on the type of data being displayed and the options that are relevant to that data. Here is a list of all of the available options, and what they will do (if present on that dashboard):
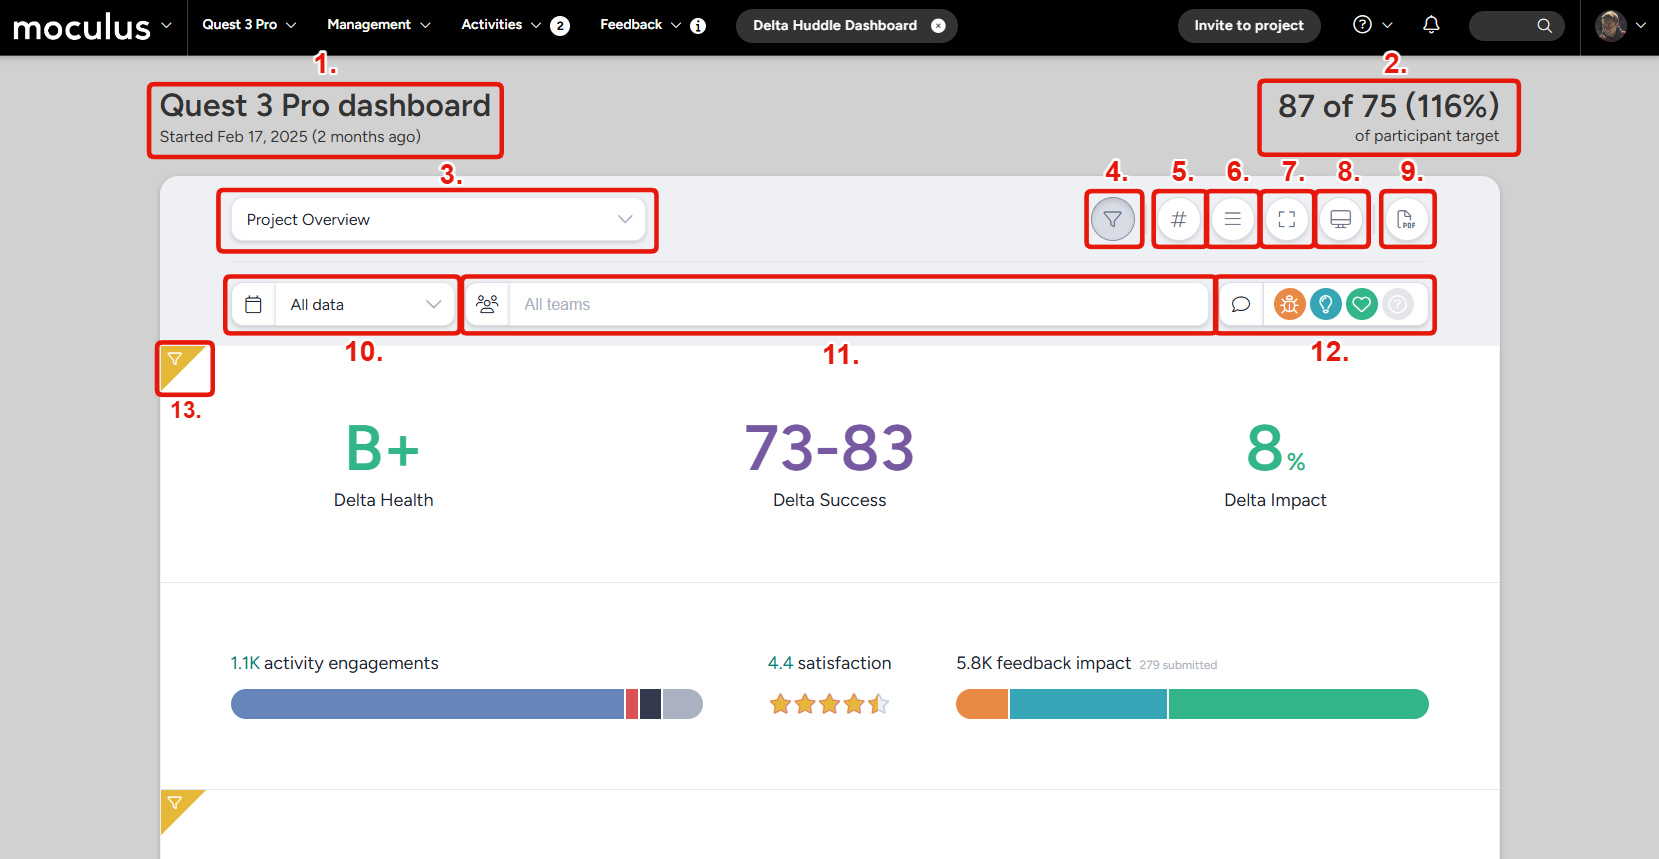
Project title and creation date: Displays the project name and creation date.Participant total and target: Displays the number of users on participant teams with access to at least one feature, compared to the target number of testers (set in the basic project settings).Dashboard selection dropdown: Allows you to select any other dashboard, or custom report to display.Dashboard filter toggle: Shows or hides the filter settings for this dashboard. If this is toggled off the dashboard will appear unfiltered.Detail mode toggle: Toggles the dashboard into detail mode, which will generally show more numbers directly, as opposed to graphic displays with hover-over capability.Feedback card mode: In dashboards that display individual feedback, toggles full feedback card display on and off.Full-width mode: Expands the dashboard to use the full available screen width.Presentation mode: Transitions the dashboard display into presentation mode, which hides the normal Centercode interface and uses a mode designed for stakeholder presentations.Print (save as PDF): Allows you to create and download a PDF copy of the displayed dashboard.Date range filter: Allows you to filter displayed dashboard data to a specific date or date range.Team filter: Narrows dashboard data to one or more user teams.Feedback type filter: Narrows dashboard data to specific feedback types.Global filter exemption indicator: Indicates dashboard elements that are NOT effected by your filter settings. The data they display is not able to be filtered.